
2. Descriptives of trends in educational inequalities
In this chapter we describe trends in inequalities of educational achievement using data from international large-scale assessment studies. Inequalities in educational achievement can be measured from several perspectives (see e.g. Ferreira and Gignoux 2014, Enchikova et al. 2024). One perspective assumes that the mere existence of variation in achievement constitutes inequality and measures inequality of achievement outcomes with indices of dispersion (e.g. Gini index, standard deviation). Another perspective focuses on inequality between groups and looks at how achievement correlates with the grouping variable in question. We adopt this latter perspective and analyse differences in educational achievement between students with different parental education, gender, immigrant status and urbanisation. When the grouping variables represent pre-determined personal characteristics, the analysis is said to study inequality of educational opportunities (Ferreira and Gignoux 2014).
The importance of these dimensions of inequality has been demonstrated by the literature. The evidence regarding the importance of the socioeconomic status (SES) of the family of origin has been reviewed by Blanden et al. (2023) and Enchikova et al. (2024). In a recent comparative study Chmielewski (2019) found strong evidence of increasing SES achievement gaps over the past 50 years across the majority of countries. Gender inequalities of educational achievement have been studied by Hermann and Kopasz (2019) and Perez-Felkner at al. (2024). Alieva et al. (2024) demonstrated that children with immigrant background show significantly lower achievement compared to native children in European countries, even after controlling for differences in socioeconomic status. Differences between students in urban and rural schools have also been studied before (see e.g. Echazarra and Radinger 2019) as urbanisation level can correlate −not only with the socioeconomic status of the families− but also with the quality of educational institutions. Our aim here is to review the trends in the past two decades using the most recent waves of ILSA data.
We also assess whether inequalities observed in primary school tend to widen or narrow down by the time students attain secondary education. This is allowed by the quasi-longitudinal design of TIMSS study, which is conducted every four years, with the fourth-grade student cohort assessed four years later at grade eight. We present such comparisons for the cohort in grade 4 in 2019 and grade 8 in 2023 in case of the countries who participated in both studies necessary to conduct the analysis.
In addition to the sequential analysis of dimensions of inequality, we are also applying an intersectional lens, looking at how different aspects of individuals’ identities interact with each other to create inequalities that cannot be understood by separate analysis of the dimensions (Varsik and Gorochovskij 2023). However, due to sample size limitations, we are not able to study every possible combination of the grouping variables. Therefore, we have limited our analysis to the study of the intersection of parental education and gender and also the intersection of parental education and urbanisation.
In the following analysis we present inequality in mathematics and reading test scores. We measure inequality between groups by the ratio of means of achievement scores of the subgroups. Achievement scores in ILSA data are calculated from raw test scores using Item Response Theory and are than standardised to a suitably selected mean and standard deviation. Ferreira and Gignoux (2014) argue that this standardisation is a monotone rank-preserving transformation, therefore test score means and measures of inequality such as the inter-quartile ratio, or the absolute inter-decile difference calculated before and after standardisation are ordinally equivalent. This means that such inequality measures rank distributions before and after standardisation similarly, even though their numeric value will be different. Ratio indices can therefore only be used to detect changes in inequality and differences between countries, but are not suitable to study the rate of change or the extent of between-country differences.
2.1. Inequality in educational achievement by parental education
In this section we use parental education as the measure of socioeconomic status. Although arguments have been made in the literature to use information on books in the home for such purposes (see Zuschlag et al. 2024) we opted for parental education because it is consistently available across our datasets. The sample is divided in two groups: the first group includes students with at least one parent/guardian with a higher education (HE) degree, while students in the second group have no parent/guardian with a higher education degree.
Figure 2.1 shows how inequality in mathematics test scores (by parental education level) changed over time, using data for Grade 4 and Grade 8 from TIMSS. The measure used is the ratio of average mathematics scores of students with highly educated parents to the average of those with no parent with tertiary diploma. Therefore, the higher the ratio, the greater the inequality in educational achievement in mathematics. The comparison is made between the first and the last year when the given country participated in the data collection. Inequality increased in countries situated above the diagonal line.
Source: own calculation, based on TIMSS data.
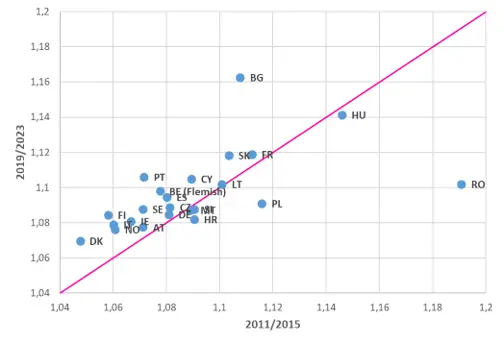
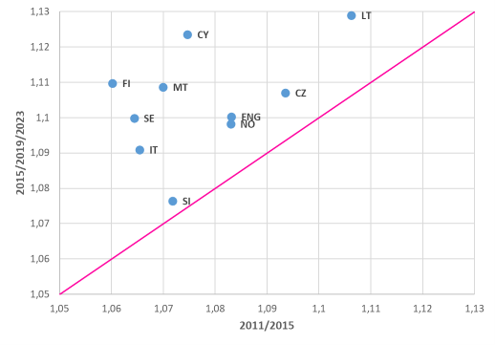
As ratios shown on Figure 2.1 are all above unity, this indicates that inequalities in mathematics achievement by parental education remain substantial across countries. According to the data from TIMSS study, in both Grade 4 and Grade 8 most countries are positioned above the diagonal, meaning that the ratio of average scores between students with high and low parental education was higher in 2019/2023 than in 2011/2015, suggesting a general widening of socioeconomic achievement gaps.
In Grade 4, changes are typically moderate, but still visible across several systems. Countries such as Hungary and Bulgaria stand out with relatively high overall levels of inequality in 2019/2023. Bulgaria, in particular, appears to show a noticeable upward shift over time. More important increases in inequality can also be observed in case of Portugal, while in Romania and Poland inequality has been declining over the period. In Grade 8, the pattern is even more pronounced as several countries display clearer increases and there are no countries where inequality seems to be declining. For example, Hungary, Cyprus and Finland are positioned well above the diagonal, indicating comparatively large growth in the achievement gap.
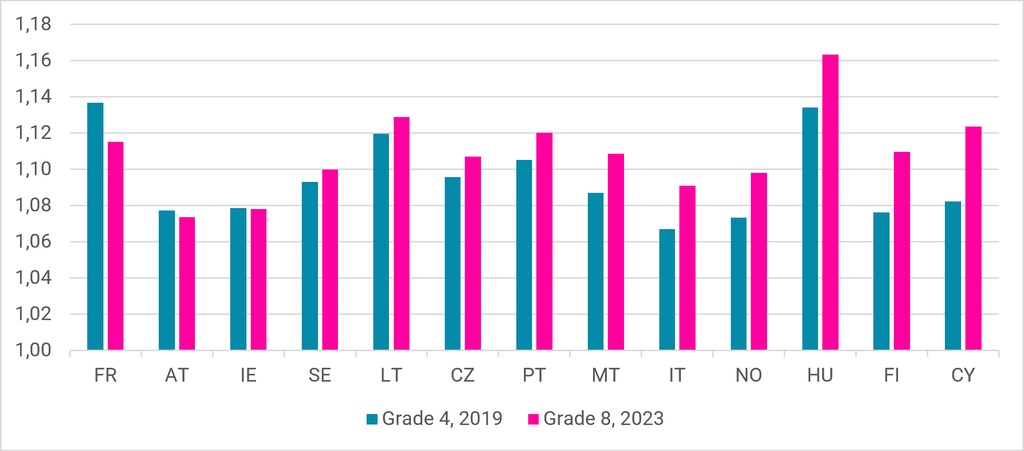
Using the quasi-longitudinal nature of the TIMSS data, we looked at whether disparities observed in Grade 4 tend to intensify as students’ progress through schooling. The comparison of inequality measured through the schooling career are shown on Figure 2.2 in case of the cohort in Grade 4 in 2019. The analysis shows that in half of the countries that participated in both studies, inequality increased from Grade 4 to Grade 8, being most accentuated in Cyprus, Finland and Hungary. In contrast, France saw inequality between students with high and low educated parents narrowing as this cohort progressed through the education system.
Source: own calculation based on TIMSS data.
Source: own calculation based on PIRLS (left panel) and PISA data (right panel).
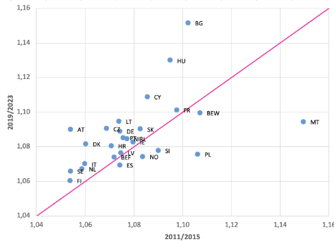
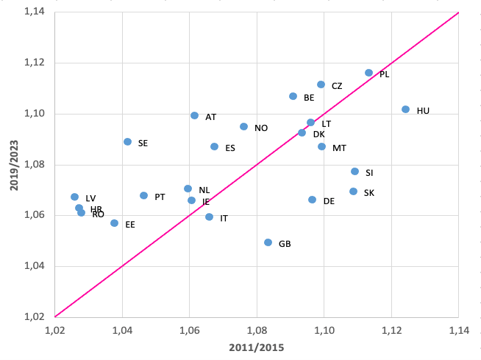
Figure 2.3 shows changes in the ratio of reading test scores between students with high and low parental education from 2011/2015 to 2019/2023, with the diagonal line indicating no change over time. In Grade 4 (left panel), most countries are clustered close to the diagonal, suggesting relatively stable levels of inequality. However, several countries exhibit noticeable increases. Bulgaria stands out with one of the largest upward shifts, moving to a clearly higher ratio in 2019/2023, indicating a widening gap. Hungary also shows a marked increase, remaining among the countries with the highest inequality levels in both periods. Cyprus and Austria also appear above the diagonal, suggesting a moderate rise. In contrast, countries such as Malta or Poland show declines relative to their earlier levels. Among student of 15 years of age (right panel), the pattern of change is somewhat more dispersed. Sweden, Austria and Latvia display noticeable increases, moving further above the equality line, while Slovenia, Slovakia, Germany and Great Britain lie further below the diagonal, indicating reductions in the relative achievement gap. Overall, the graph (Figure 2.3) suggests that while inequality in reading achievement by parental education remains persistent across countries, countries show mixed trends during the period studied.
2.2. Inequality in educational achievement by gender
In this section, we study gender differences in educational achievement, measured as the ratio of boys’ to girls’ average scores in mathematics and reading. Figure 2.4 shows changes in gender inequality in mathematics test scores, where values above one indicate that boys outperform girls, while values below unity indicate a female advantage.
Source: own calculation based on TIMSS data.
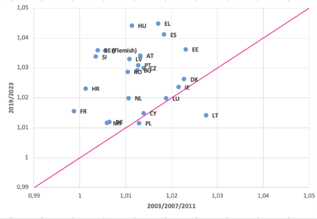
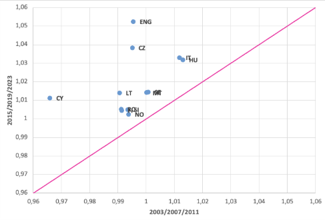
In Grade 4, gender gaps are generally small, showing a moderate advantage of boys in mathematics test scores. However, many countries lie slightly above the diagonal, suggesting a modest increase in boys’ advantage in recent years. For example, countries such as Hungary, Greece, Spain, Belgium, Italy and Slovenia appear above the line, indicating some widening of the gender inequality. Also, a few countries remain close to the diagonal, pointing to relative stability of inequality over time.
In Grade 8, gender inequalities tend also to be generally moderate. Several countries — notably England, the Czech Republic and Cyprus — are clearly positioned above the reference line, indicating that the boys’ advantage in mathematics performance has increased over time. Overall, the findings indicate that while gender differences in mathematics remain moderate compared to socioeconomic gaps, there is evidence in several countries of a growing gender inequality in favour of boys.
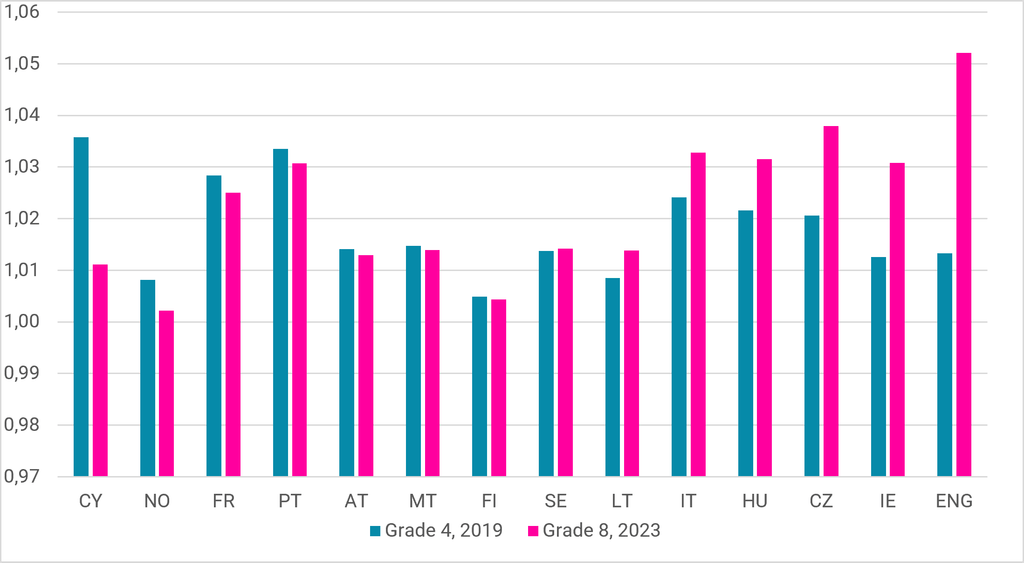
Figure 2.5 shows changes in inequality as students’ progress through schooling using the quasi-longitudinal nature of the TIMSS data. The 2019 Grade 4 cohort the advantage of boys in mathematics test scores widened from primary to secondary education in England, Ireland and the Czech Republic, while in Cyprus gender inequality declined.
Source: own calculation based on TIMSS data.
Source: own calculation based on PIRLS (left panel) and PISA data (right panel).
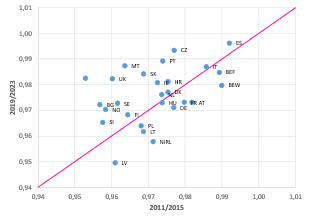
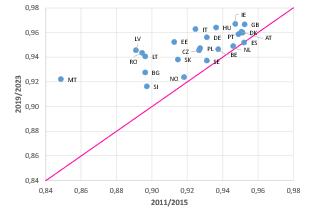
Figure 2.6 presents changes in the boys/girls ratio of reading test scores between 2011/2015 and 2019/2023. Because the ratio is below unity in almost all countries—especially at age 15—it confirms that girls outperform boys in reading across systems. In Grade 4 (left panel), most countries lie close to the diagonal, suggesting relatively small changes in gender inequality over time. However, some countries show more noticeable shifts. Countries such as Czechia, Malta, UK and Cyprus show some narrowing of the inequality, as boys’ performance improved relative to girls. In contrast, in case of Latvia and Northern Ireland a slight decline in the ratio can be observed indicating a widening inequality in favour of girls.
In the age-15 panel, the pattern of change in gender inequality is somewhat more varied. Malta is a clear outlier indicating a sizeable narrowing of the gender gap over time. The Baltic States, Italy and Romania also lie above the diagonal line, suggesting modest narrowing of the gender gap. Overall, the graph indicates that the gender inequality in reading is moderate and larger at age 15 than in Grade 4. Changes over time are generally moderate, with only a few countries exhibiting more pronounced shifts.
2.3. Inequality in educational achievement by migration status
In this section we study inequality in educational achievement by migrant status, measured as the ratio of migrant to non-migrant students’ average test scores. Immigrations status is defined based on country of birth to maximise comparability between studies and years. The focus is therefore on first-generation migrant children and the compared groups are those students not born in country (migrants) and students born in the given country (non-migrants). A value below unity indicates that migrant students score lower on average than non-migrant students, while values closer to one indicate smaller inequality.
Source: own calculation based on TIMSS data.
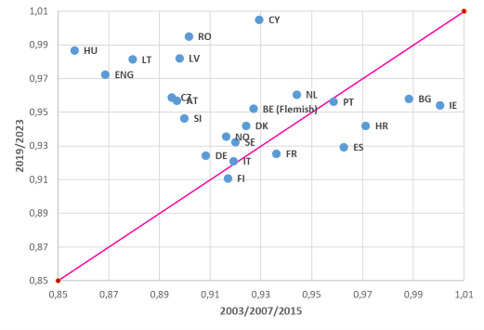
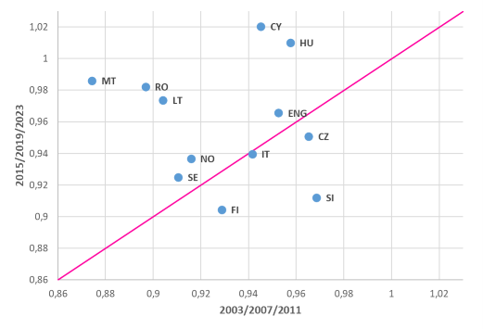
Figure 2.7 shows the migrant/non-migrant ratio of mathematics test scores at the first and last year of observation. In Grade 4, most countries have ratios below one, confirming that migrant students tend to underperform relative to their non-migrant peers. However, many countries are positioned above the diagonal, suggesting some improvement over time. For example, countries such as Cyprus, Romania, Hungary, England, Lithuania and Latvia appear in the top left part of the graph, indicating a decline of migrant disadvantage. At the same time, other systems, like Ireland, Bulgaria, Croatia and Spain remain below the diagonal line implying slight widening of the disparities. Overall, while disparities persist, there is evidence of moderate convergence in several countries at the primary level.
In Grade 8 most countries still show migrant students scoring below non-migrant peers and there seems to be considerable dispersion around the diagonal line. Some countries, such as Cyprus, Hungary, Malta, Romania and Lithuania appear above the line, suggesting improvements in migrant students’ relative position. Although most of the countries we see stability over time in the relative mathematics performance of migrant students, in case of Finland and Slovenia the figure shows a widening gap in recent years. Overall, the findings suggest that while some education systems have reduced migrant–non-migrant achievement gaps over time, substantial disparities remain.
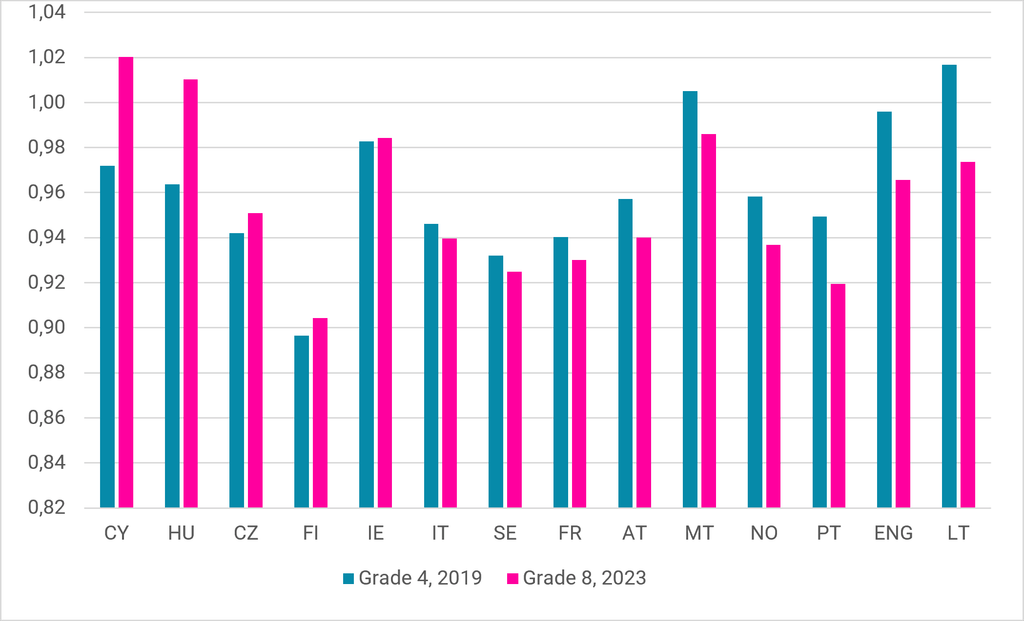
Figure 2.8 shows changes in inequality as students’ progress through schooling using the quasi-longitudinal nature of the TIMSS data. Migrant disadvantage increased the most in Lithuania, England and Portugal. In contrast migrant disadvantage seems to be declining as students progress from Grade 4 to Grade 8 in Cyprus and Hungary.
Source: own calculation based on TIMSS data.
Source: own calculation based on PIRLS (left panel) and PISA data (right panel).
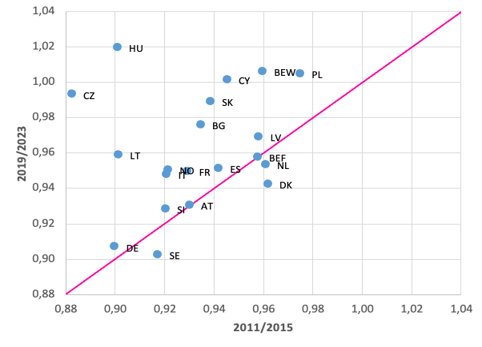
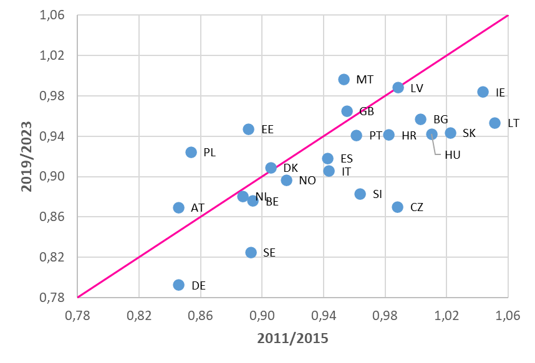
Figure 2.9 displays changes in the migrant/non-migrant ratio of reading test scores between 2011/2015 and 2019/2023. Since most ratios are below one, migrant students generally score lower than non-migrant students in reading across countries, particularly at age 15. In Grade 4 (left panel), the majority of countries cluster around the diagonal, indicating relatively modest changes in migrant disadvantage in reading achievement. However, some notable shifts are visible. In Hungary and the Czech Republic a decline in migrant disadvantage can be observed over time, with migrant students improving relative to non-migrants. Similar trends can be observed in Belgium (Wallonia), Cyprus, Slovakia, Bulgaria and Lithuania, albeit to a lesser extent. By contrast, Denmark and Sweden fall slightly below the diagonal, pointing to a widening inequality in favour of non-migrant students.
In the age-15 panel (right), inequality levels are generally larger and the dispersion across countries is more pronounced. A number of countries show a marked decline in the ratio, indicating a substantial widening of the migrant gap: Germany, Sweden, Slovenia, Czechia, Hungary, Slovakia, Lithuania and Ireland show notable downward shifts. In contrast, in Malta, Poland and Estonia a narrowing of disparities can be observed at age 15. Overall, the graph suggests that migration-related inequality in reading achievement remain persistent and often sizeable, especially at age 15. The direction of change differs between the Grades, as there are more countries showing declining inequality in Grade 4, while the majority in Grade 8 recorded increasing inequality between migrants and non-migrants.
2.4. Inequality in educational achievement by urbanisation
This section describes inequalities in educational achievement by school location, measured as the ratio of average scores in urban versus rural areas. We defined urban areas as those areas, where more than 15,000 live in area, and rural where up to 15,000 live in the area. This was decided in order to ensure a sufficient sample size for the calculation of the indicators. A value above one indicates that students in urban schools outperform those in rural schools, while values below unity indicate a rural advantage. Countries above the diagonal line experienced an increase in the urban–rural inequality over time, while those below the line saw a reduction.
Source: own calculation based on TIMSS data.
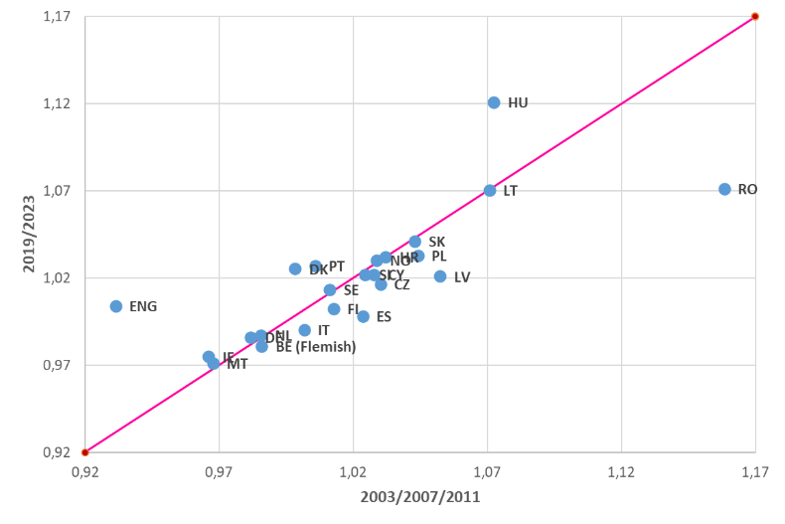
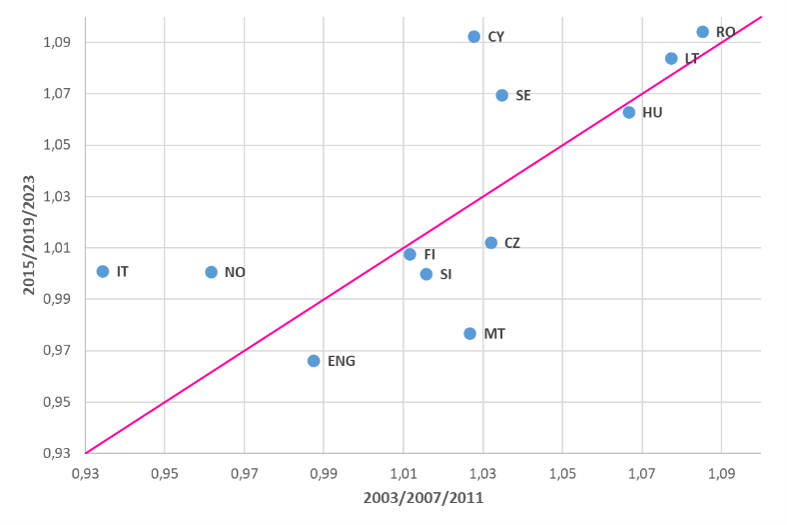
As Figure 2.10 shows most countries have ratios slightly above one, indicating that students in urban schools tend to outperform students in rural schools in mathematics achievement. In Grade 4 most countries are positioned close to the diagonal line, suggesting that the urban-rural inequality in mathematics achievement has only moderately changed over time. Exceptions to this trend are Hungary and England, which are clear cases of a growing disadvantage of students in rural schools. In contrast, urban advantage has been declining in Romania.
In Grade 8, the pattern is somewhat more dispersed. While the disadvantages of students in rural schools remain visible in many systems, several countries are close to the diagonal, indicating relative stability. However, countries such as Cyprus, Italy, Sweden and Norway show an increasing urban–rural divide at lower secondary level. At the same time, in countries such as Malta or England a reduction in the urban–rural inequality can be detected over time. Overall, the findings suggest that urban–rural disparities in mathematics achievement are moderate and stable in primary education, while somewhat larger in secondary education.
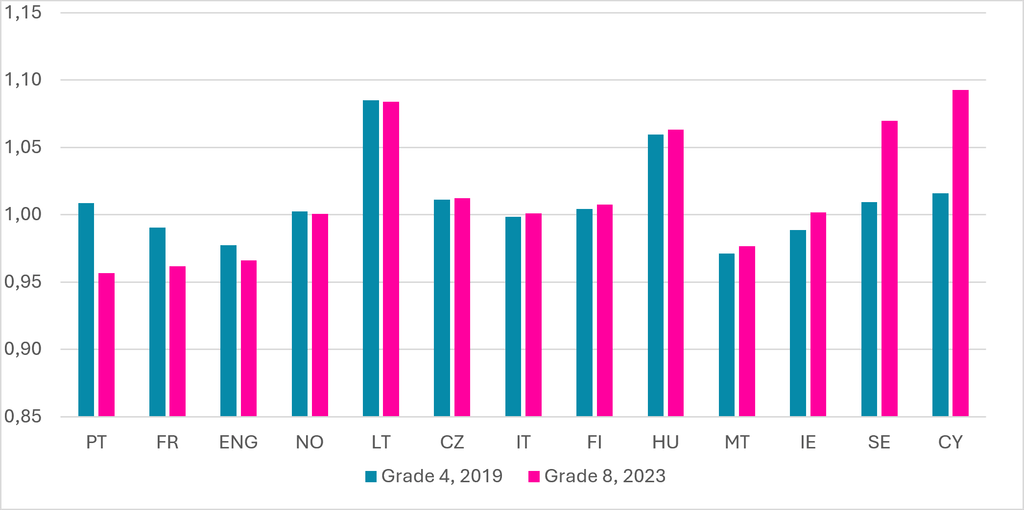
The quasi-longitudinal nature of the TIMSS data allow to follow the progression of a cohort in the education system. Figure 2.11 shows changes in inequality between Grade 4 and Grade 8 in case of the student cohort who was in Grade 4 in 2019. According to the results the advantage of urban students increased in Cyprus and Sweden, while it decreased in Portugal and to some extent in France.
Source: own calculation based on TIMSS data.
Source: own calculation based on PIRLS data.
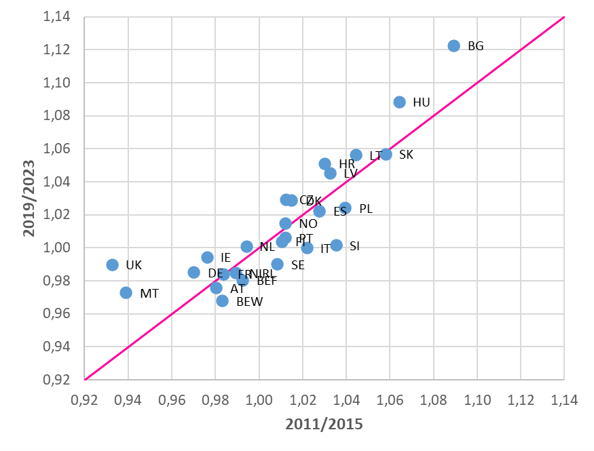
Figure 2.12 presents changes in the urban/rural ratio of Grade 4 reading test scores between 2011/2015 and 2019/2023. In case of reading performance, no data is available for Grade 8, as PISA does not provide information on school location. Most countries cluster around the diagonal, suggesting broadly stable urban–rural disparities over the period. However, some countries exhibit more pronounced shifts. Bulgaria, Hungary, Malta and the UK stand out clearly, showing an increase in the ratio and thus an increasing relative performance of students from urban schools. In contrast, in a few countries – most notably in Slovenia – a decline of urban advantage has been observed. Overall, the graph suggests that while urban students continue to outperform their rural peers in most systems, changes over time have generally been moderate.
2.5. Intersectional inequality by gender and parental education
The present section examines inequality at the intersection of gender and socioeconomic status, measured here as the education level of parents. Rather than discussing overall inequality, we focus specifically on the relative educational performance of one specific group, in this case of girls whose parents do not have higher education qualifications. The indicator (see values on Figure 2.13) shows their average score relative to the overall mean test score, with values below one indicating a disadvantage. Countries above the diagonal line on the graphs experienced an increase in the relative score over time (a narrowing of disadvantage), while those below the line saw a decline (widening inequality).
Source: own calculation based on data from TIMSS.
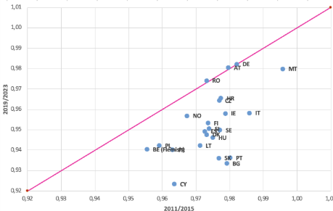
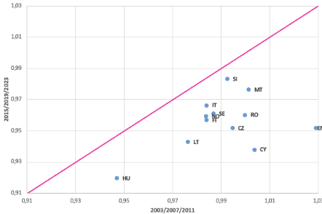
In Grade 4, most countries are clustered below a ratio of one in both periods, indicating that girls from lower-educated families perform below average in mathematics across systems during the period studied. Most countries tend to lie below the diagonal line, suggesting that the relative position of girls from lower—educated families has somewhat deteriorated over time. Most important decline in the relative position of this group was seen in countries such as Bulgaria, Cyprus, Slovakia and Portugal. A smaller number of countries—such as Germany, Austria or Romania — show stability of the relative performance of girls from lower-educated families. Overall, the pattern suggests that compounded disadvantage linked to both gender and low parental education remains persistent at primary level.
In Grade 8, the dispersion is somewhat greater. At the beginning of the period England, Cyprus and Malta had relative scores higher than one, while relative scores remain below unity in all countries at the end of the period, suggesting that girls with no parents with higher education continue to perform below average in Grade 8. All countries appear below the diagonal line suggesting a growing disadvantage over time for this group in lower secondary education. The most important decline in the relative position of girls from lower—educated families was seen in Cyprus, England, and also in Lithuania, Czech Republic and Romania. Overall, the findings highlight that when gender and socioeconomic disadvantage intersect, inequalities in mathematics test scores tend to be more pronounced and, in many systems, have not diminished over time.
Source: own calculation based on PIRLS (left panel) and PISA data (right panel).
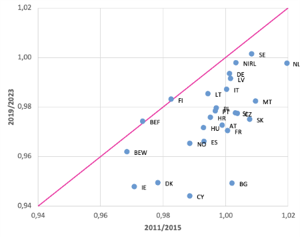
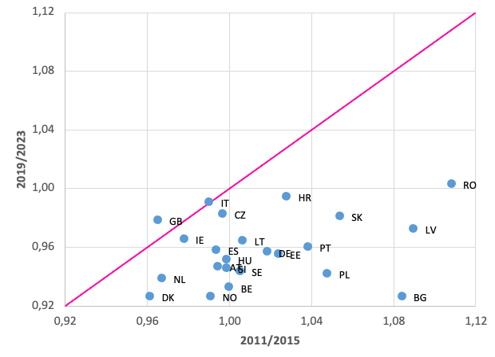
Figure 2.14 presents changes in the relative reading performance of Grade 4 (left panel) and Grade 8 (right panel) girls whose parents do not have higher education qualifications. In Grade 4, at the beginning of the period average reading test scores in this group were above the overall mean for roughly half of the countries, but at the end of the period only Sweden has a relative test score higher than one among girls with lower educated parents. Regarding changes over time, there are few systems (most notably Finland and Belgium), where the relative position of girls from less-educated families remained stable or declined only slightly. By contrast, in countries such as Bulgaria, Cyprus, Denmark and Ireland data indicate a deterioration in relative outcomes for this group. Several others (e.g. France, Austria, Hungary, Spain) show small downward shifts, implying mild widening of disadvantage.
The Grade 8 pattern shows somewhat greater dispersion. While many countries (e.g. Italy, Czech Republic, Great Britain) remain close to the diagonal line, indicating stability, a number of systems fall noticeably below it. In particular, Bulgaria, Poland, Latvia and Romania exhibit marked downward shifts, suggesting a substantial decline in the relative achievement of girls without highly educated parents. These countries had relative test scores above unity in the beginning of the period and then were below (or close to) parity at the end of the period. In sum, the figure suggests that relative inequalities for this group have been broadly stable at Grade 4 but somewhat more volatile at Grade 8, with several countries experiencing a widening disadvantage by the end of lower secondary education.
2.6. Intersectional inequality by urbanisation and parental education
In this section we examine inequality at the intersection of urbanisation and education level of parents, by focussing specifically on the relative educational performance of rural students whose parents do not have higher education. The indicator shows their average score relative to the overall mean test score, with values below unity indicating a disadvantage. The 45-degree line marks stability over time: countries above the line experienced an improvement in the relative position of this group, while those below it saw a decline.
Source: own calculation based on data from TIMSS.
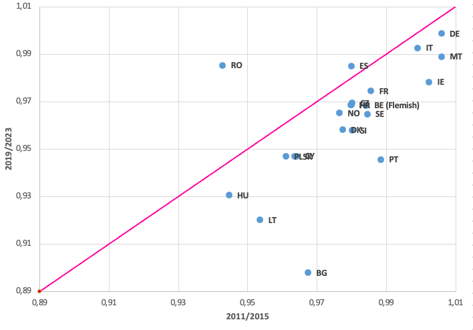
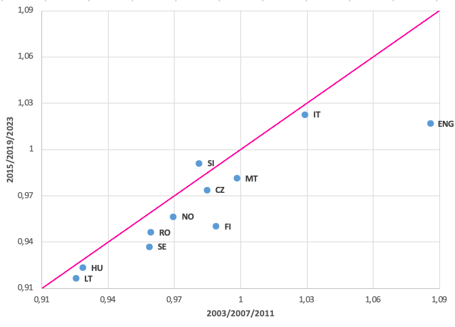
Figure 2.15 shows relative mathematics test scores for the group of interest. At Grade 4 (left panel), most countries have relative test scores below unity, showing that students in rural schools with no parents with higher education perform below average. It is also clear, that most countries cluster close to the diagonal line, indicating broadly stable relative outcomes over the period. However, Bulgaria stands out clearly with a substantial downward shift, indicating a marked deterioration in the relative performance of the group. Similar changes have been detected in Lithuania and Portugal, albeit to a lesser extent. In contrast, some improvement in the relative performance of this group is observed in Romania. In most other cases (e.g. France, Germany, Italy, Belgium), changes are modest and remain within a relatively narrow band.
The Grade 8 pattern (right panel) is similar, showing disadvantage among these students as most countries (except Italy and England) are below a value of one. Most important disadvantage is recorded in Lithuania and Hungary. Disadvantage of this group seems to be broadly stable over the period, as most countries are close to the diagonal line. Most important change is seen in England, where the relative position of this group declined over time, despite a comparatively high initial ratio. Finland also shows a modest widening of disadvantage. Overall, the figure suggests that for rural students without highly educated parents, relative inequalities in mathematics have remained broadly stable in most systems but have widened in a few others.
Source: own calculation based on data from PIRLS.
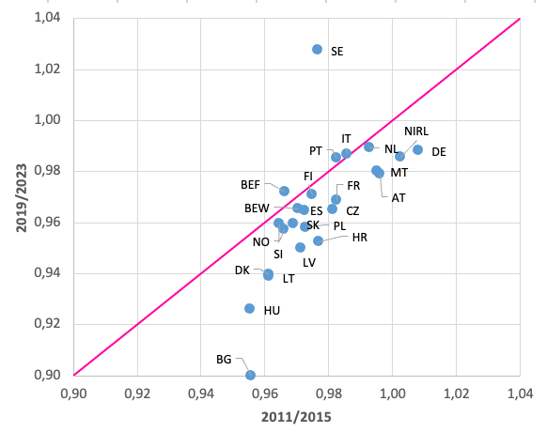
Figure 2.16 presents changes in the relative reading performance of Grade 4 students in rural schools whose parents do not have higher education. In case of reading performance no data is available for Grade 8, as PISA does not provide information on school location. The relative test score in this group tends to be below unity in the majority of countries, showing below average performance. Most countries cluster around the diagonal, suggesting broadly stable relative test scores. An exception is Bulgaria, which stands out most clearly with a pronounced downward shift, pointing to a substantial deterioration in the relative position of this group. Hungary, Lithuania, Latvia and Croatia also show some widening of the disadvantages among students with lower educated parents in rural schools. By contrast, Sweden is clearly above the line, indicating a noticeable strengthening of the relative position of this group.
Overall, the figure suggests that while relative reading inequalities for disadvantaged rural Grade 4 students have remained broadly stable in many countries, some systems—most notably Bulgaria—have experienced a marked deterioration, whereas a smaller number have achieved modest improvements.