
Interactive Map
What is the interactive map?
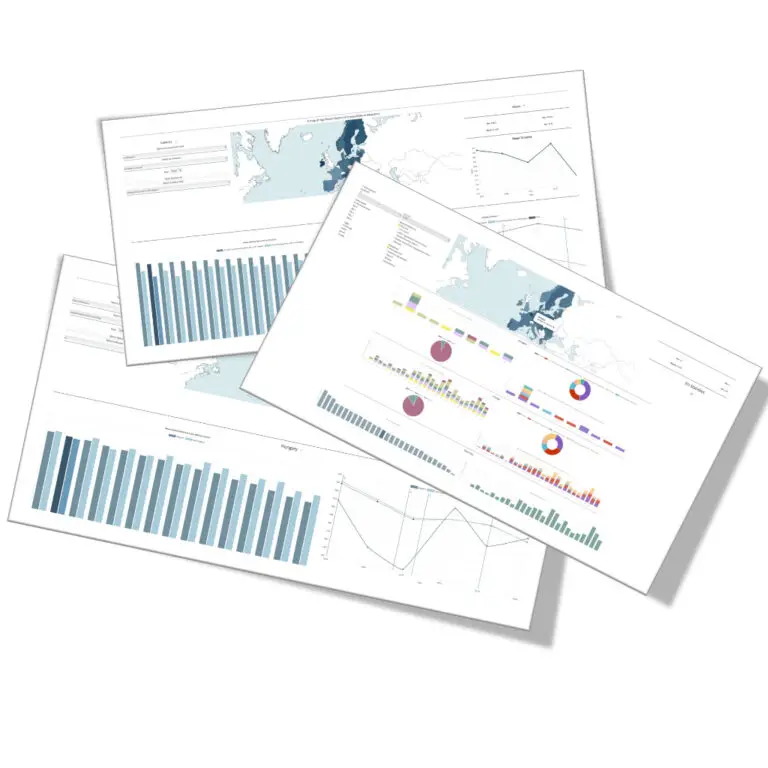
The interactive map illustrates the key factors in policy development and student achievement that foster or hinder equity, inclusion and resilience in education, training and learning outcomes over time.
The interactive map visualizes central drivers of educational inequalities across Europe and integrates data from policy analyses, systematic reviews and large‑scale educational assessments.
It provides a comprehensive overview of the factors contributing to inequalities in education and learning outcomes across 29 European countries, drawing on longitudinal evidence from the STRIDE project.
The map identifies relevant policies, practices and socio‑economic contexts that can support equity, inclusion and resilience in education systems and strengthen collaboration between researchers, educators and other stakeholders.
How do you use it?
The structure of the interactive map is established based on a round consultation with national and European stakeholders. In this way we make sure that the map will include data and features of the public needs.

Data and information visualisation is the process of representing data in a graphical and expressive manner to facilitate understanding, allowing the wider audience to look for or discover what is implied from large amounts of data in a well-organised and successful way.
Data visualisation is specifically effective as a means of reading between the numbers and transforming raw data into eloquent graphical representations.
This will be achieved through the categorisation of existing data, including definition of categories, indicators and by refining of data in order to render them comparable.
A dynamic tool that will provide the possibility of comparison and visualisation of data as well as the possibility of potential updates in case of new rounds of data inputs.
Monitoring processes and trends in outcomes can foster their improvement and provides important feedback for policy making. A careful selection of indicators is necessary to provide a coherent picture on the significant factors in policy development and student achievement over time.